
The symptom
The window was jumping in ways the UI didn't explain.
Jarvis v2 runs a dual-brain setup. A small model (Qwen 3.5 4B) handles fast turns at the front. A big model (Gemma 4 26B) does the heavy lifting in the background. Both share one LM Studio instance, routed by model_id on every call. Every time the big brain finishes a result, a reviewer pass critiques it and ships a fix cycle back. That reviewer loop was bloating my context.
One user message. Two or three back-and-forths. Context: 22%. Fine. Reviewer fires, fix comes back. Context: 60%. For a single reply.
Nothing on the surface explained it. The critique is three bullets. The rules are a short block. The fix message on screen is a few hundred characters. So how does that eat 40% of the window?
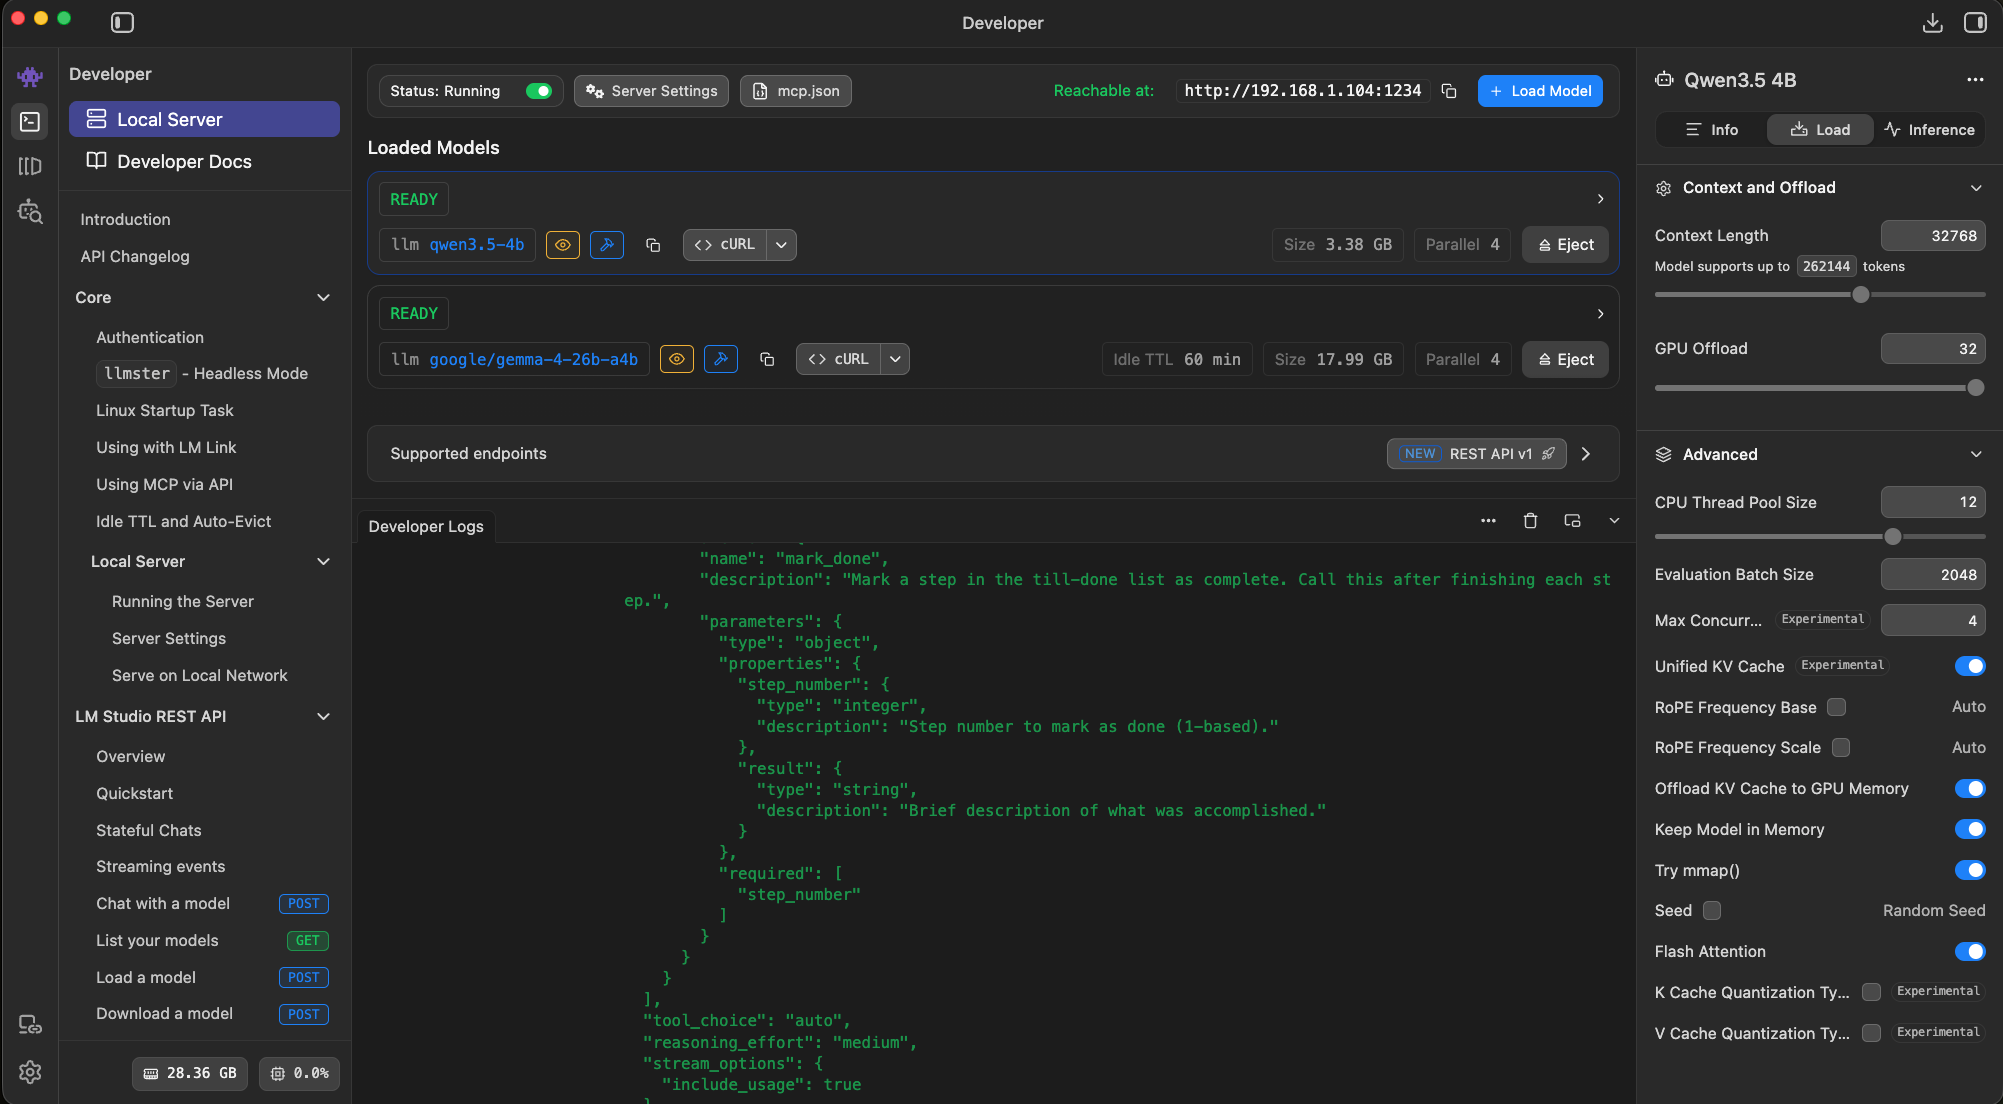
The dual-brain setup. Same LM Studio instance, two models, routed by model_id on every call.
You can't QA an agent by reading the code that calls the API. You have to watch the actual payload go over the wire.
— A rule I've stopped questioning
The QA step I kept avoiding
Dump the payload right before the call.
I'd been trying to trace the leak by reading my own code. Counting string lengths in the injection functions. Logging the critique. None of it added up to a 40% jump.
The fix was the thing I kept avoiding. Print the entire message object right before it hits the LM Studio endpoint, then count the tokens. That's the only source of truth. Everything else is a guess about what the code probably sends.
So I added a two-line debug hook. Wrapped the API call, dumped the payload to a file, piped it through tiktoken.
12,074 tokens. For a reviewer fix message that looked three bullets long on screen.
Where it was hiding
The fat artifact snapshot.
The injection code was attaching a full artifact snapshot to every fix message. Every file the session had touched, full source, line numbers and all. The intent was well-meaning: give the reviewer "fresh eyes" context so it wouldn't need to go re-read anything.
In practice the reviewer was getting ~7,500 tokens of source code that the big brain had literally written three minutes ago. Plus two blocks of hard rules. Plus the critique itself. About 12,000 tokens injected per review cycle, and a session runs two or three of those before work is done.
The model didn't need any of that. It had already written the file. What the reviewer actually needed was a pointer, not a transcription.
The fix
A lean index instead of a fat snapshot.
The replacement is one line per file, no contents:
styles.css            (132 lines, 4,204 chars)
index.html            (88 lines, 2,911 chars)
design-system.json    (41 lines, 1,210 chars)
That's 220 tokens. Down from 7,500 for the snapshot it replaced. A 97% drop on the heaviest single message in the review flow.
The shape matters more than the number. Instead of dumping every file the session touched into the reviewer's first message, we hand it a table of contents. Names, line counts, sizes. It knows what exists. If it needs the actual content of a file, it can call read_file and pull just that one.
That shift does two things at once. The cold start on every review cycle drops from 12,000 tokens to 220, so the first model turn happens fast instead of burning a full forward pass on context it probably doesn't need. And the context grows on demand instead of on arrival. The reviewer pulls the files it cares about, in the order it needs them. The model manages its own window. I stop guessing for it.
In practice it almost never asks for file contents, because the critique is usually about something it already flagged the previous pass. The index is enough to remember what exists and what's changed since the last cycle.
Latest runs confirm it. Context holds steady across multiple review cycles now. The jamming behavior is gone. Sessions that used to hit the ceiling after two cycles now run five without breaking stride.

Same message, same information. Swapping a full snapshot for a lean index dropped the cost from ~11,550 to ~770 tokens.
The broader lesson
Your agent's 'thinking out loud' is billed in tokens.
If you're building on a local model, a leak like this tanks generation quality after a few turns. The window fills with stale context and the model starts forgetting the early messages.
On a cloud API, the same leak is a silent invoice. Nobody flags a $50/day overage when the feature still works. It just works expensively.
The only way to see either is to watch the payload. Not the message on screen. Not the log line. The actual bytes going to the model.
Write a debug hook that dumps the full request right before every API call. Run your flow end to end. Count tokens per message. You'll find something.
Share this post
Keep reading
More worth your time

Blog post · AI, Building, Process
The Context Window Is a Trap
We chased million-token context windows for years. The rot didn't get fixed. It just moved somewhere quieter.
Read post →
Blog post · AI, Building, Process
Catching the 7,000-character write
When your local model's tool call drops a required parameter and a long file almost gets thrown away.
Read post →Stay in the loop
New posts, same voice.
Get a short email when I publish something new. No weekly digests, no link dumps — just the essays.